Case Study: Ready-Mix Concrete
Inventory accuracy at the Quikrete Ocala ready-mix plant
At a high-volume ready-mix plant in Ocala, Florida, Hyperion scans were compared with truck tickets to measure real aggregate inventory. The results exposed discrepancies that ticket-based accounting had missed.
The challenge
Tracking aggregate inventory at the Ocala RMX plant
The Quikrete Ocala RMX plant is a high-volume ready-mix concrete operation with a constant flow of limestone and sand. Rapid turnover makes accurate ready-mix aggregate inventory hard to maintain.
The plant relied exclusively on truck tickets to track inventory. Tickets introduce variables such as moisture, scale calibration and inconsistent material flow, and those variables add up to costly discrepancies. That made the plant an ideal place to compare LiDAR-based scanning directly against ticket-based accounting.
- High material throughput. Frequent deliveries and draws complicate tracking.
- Multiple aggregate types. Each material needs its own precise count.
- Operational complexity. A constant balance between theoretical, physical and production inventory.
Over a three-month period (March to May 2025), theoretical inventory, physical inventory and Hyperion scan data were compared month by month, along with a gain/loss analysis, to identify discrepancies. Ticket-based gaps of more than $160k were observed.
Control tests
Control tests against truck tickets
In isolated control tests, the change in a single pile measured by Hyperion was compared with the truck tickets for the same period, showing consistent agreement between the two methods.
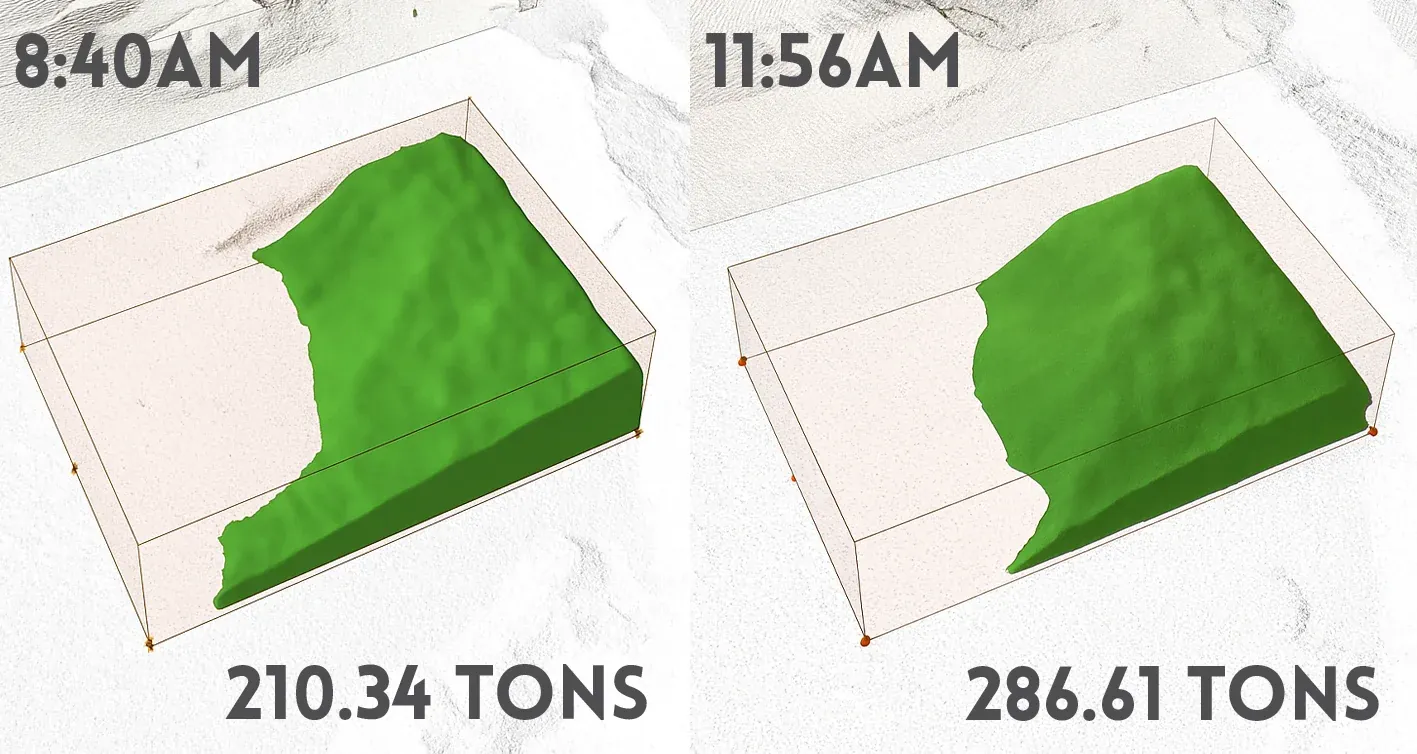
Control test 1
| Truck tickets | 81.16 st |
|---|---|
| Hyperion | 76.23 st |
| Difference | 4.93 st (6%) |
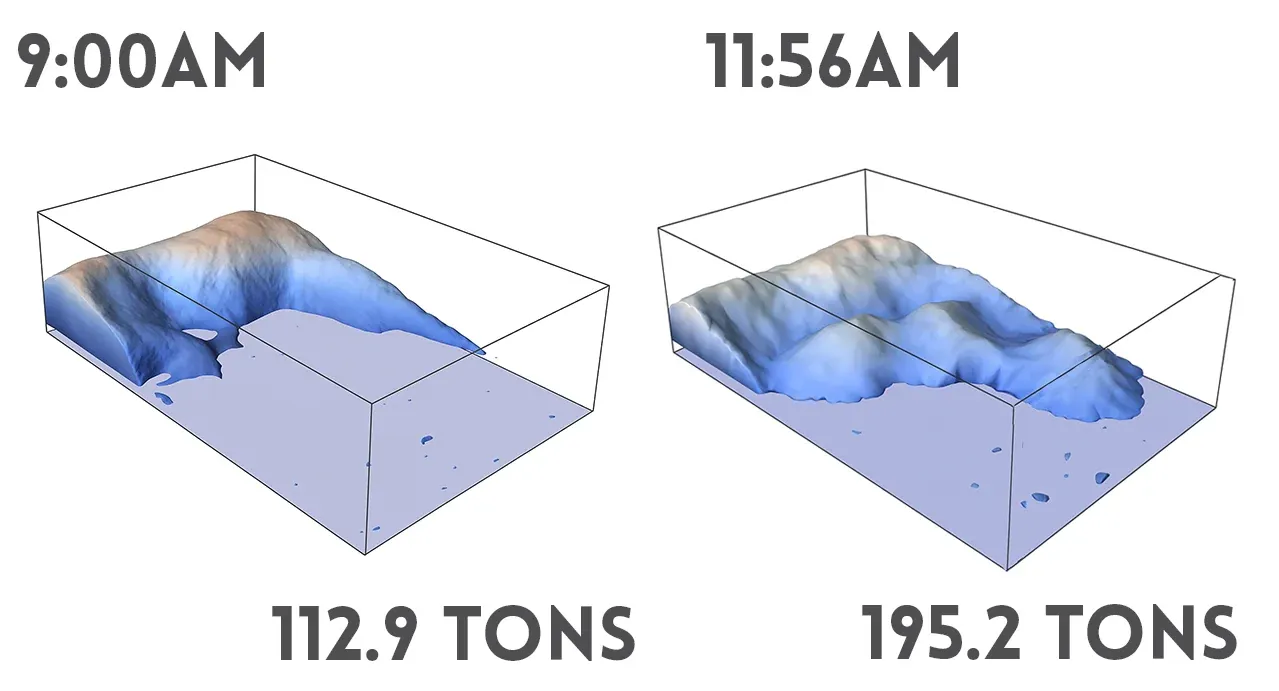
Control test 2
| Truck tickets | 85.82 st |
|---|---|
| Hyperion | 82.3 st |
| Difference | 3.52 st (4%) |
st = short tons. Ticket weights include the moisture and scale variables described above, so small differences are expected.
Investment
Hyperion cost analysis
What the Ocala deployment cost to install and run.
Initial investment
Hardware, network setup, installation and the first month of service.
A one-time cost to get the plant scanning.
Recurring costs
Predictable operating costs for 24/7 inventory data.
| Scanner lease | $450 |
|---|---|
| Scanner data | $175 |
| Wireless data | $50 |
| Annual total | $8,100 |
Costs shown are for this project. See current Hyperion software pricing and EOS2 LiDAR sensor purchase and lease options.
Conclusion
A clear, measurable advantage over ticketing
The study at the Quikrete Ocala RMX plant shows the advantage of Hyperion over a ticket-only system. Ticket-based management accumulates errors over time, while Hyperion measures the stockpiles directly and reflects the true state of inventory.
With Hyperion, ready-mix producers gain a scalable, reliable way to track aggregate inventory, and turn that data into decisions about purchasing, production and loss prevention.
Discuss your plantOcala case study FAQ
In two isolated control tests, tickets showed 81.16 and 85.82 short tons while Hyperion measured 76.23 and 82.3 short tons, differences of 6% and 4%.
The initial investment was $6,600, covering hardware, network setup, installation and the first month of service. Recurring costs were $675 per month ($450 scanner lease, $175 scanner data, $50 wireless data), or $8,100 per year.
Comparing theoretical inventory, physical inventory and Hyperion scan data month by month from March to May 2025 revealed ticket-based gaps of more than $160k.
Related
Contact
Find the gaps in your aggregate inventory
Tell us about your plant, your aggregates and how you track inventory today, and we will show you what Hyperion can measure.
- +1 352-283-8003
- info@altamusinc.com
- 4936 SW 91st Ter M102
Gainesville, FL 32608