Technology
How LiDAR stockpile measurement works
LiDAR stockpile measurement uses laser pulses to map the exact shape of a pile, then software converts that shape into volume and tonnage. Here is how the EOS2 LiDAR sensor and Hyperion software do it, step by step, and how the approach compares with other ways of measuring inventory.
LiDAR basics
What is LiDAR, in plain language?
LiDAR stands for Light Detection and Ranging. A LiDAR rangefinder sends out a short pulse of laser light and measures how long it takes to bounce off a surface and come back. Because light travels at a known, constant speed, that round-trip time converts directly into distance. This principle is called time of flight.
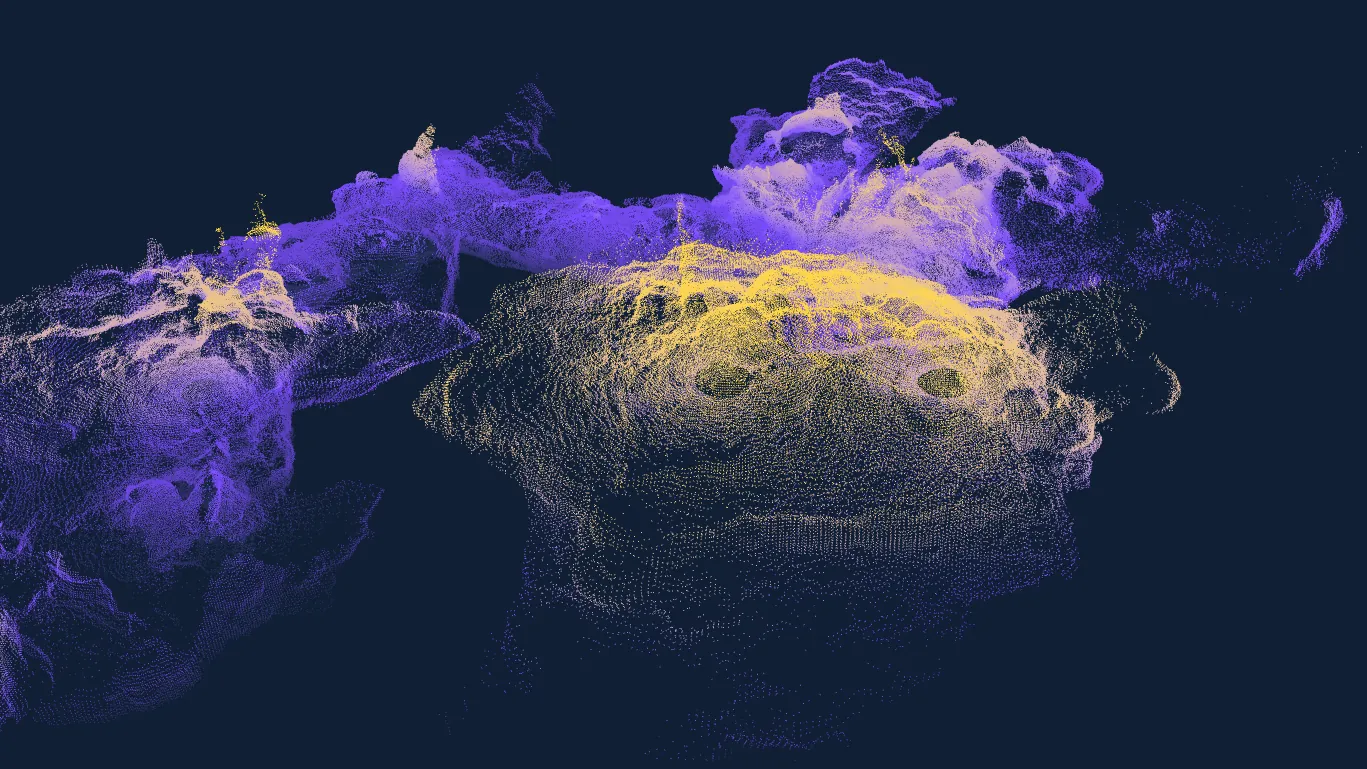
One distance measurement on its own is not very useful. But when the sensor also knows exactly which direction it was pointing, each measurement becomes a single point in 3D space. Repeat that tens of thousands of times in every direction and you get a point cloud: a dense set of 3D points that traces the surfaces around the sensor, including the top of every stockpile.
That is the foundation of LiDAR volume measurement. Once you have an accurate 3D surface of a pile and the floor beneath it, the volume between them is a geometry problem that software can solve quickly and consistently.
Data capture
How the EOS2 captures a 360° scan
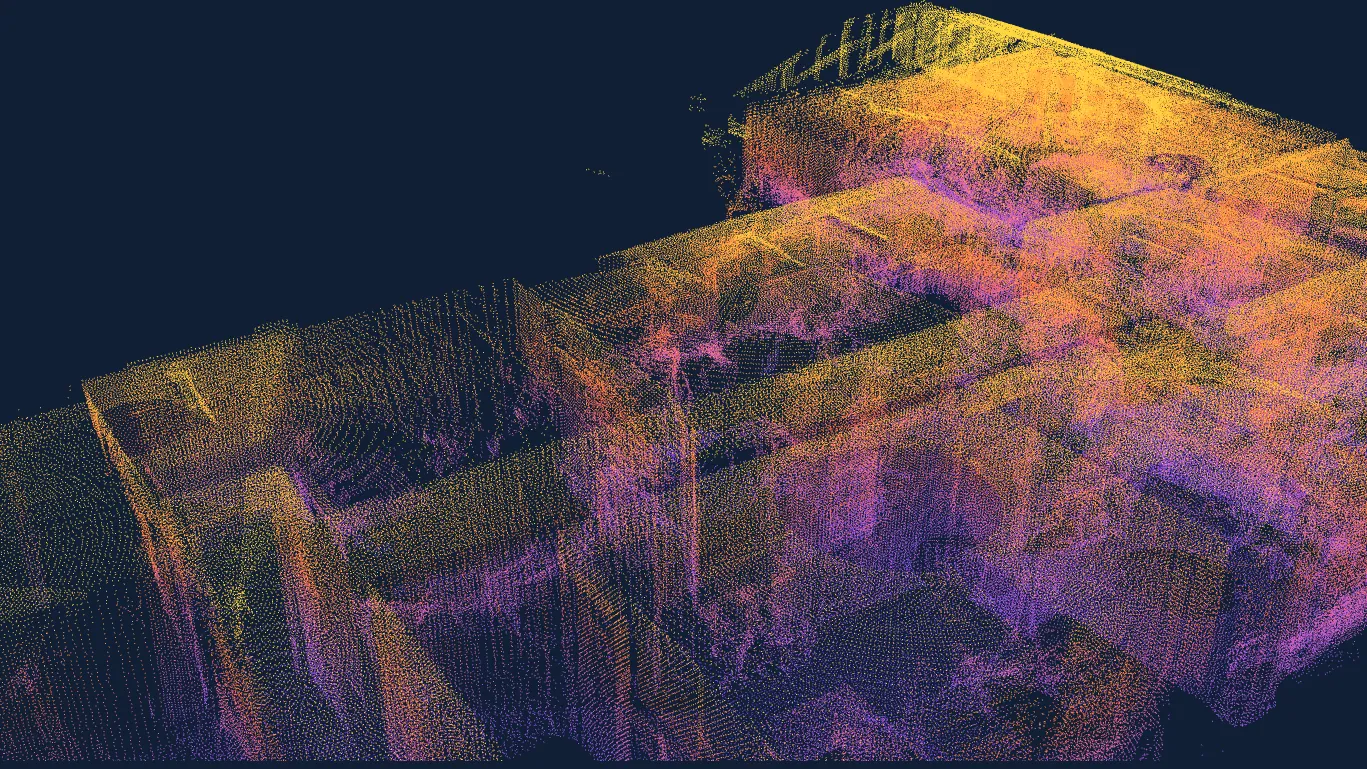
The EOS2 LiDAR sensor is a fixed, permanently mounted scanner. It builds a complete spherical point cloud of its surroundings without anyone on site.
Trigger a scan
Scans run on a schedule or on demand. The sensor receives the request over Wi-Fi, with Bluetooth available for local setup.
Sweep the sphere
High-precision stepper motors rotate the rangefinder head through a full 360° × 180° field of view, taking a distance reading at each angle.
Record every point
At 1° angular resolution a full scan takes about 3 minutes, with 0.25° angular accuracy and 1% rangefinder accuracy.
Send the point cloud
The finished point cloud is uploaded to Hyperion for processing. Between scans the sensor idles at 25 mA on 12 VDC, low enough for solar power.
The EOS2 uses an eye-safe Class 1 laser and is an active sensor, so it measures the same way in daylight, at night or inside a dark storage building.
Processing
From point cloud to volume in Hyperion
Raw points are not an inventory number. Hyperion runs each scan through an automated pipeline that ends in a quality-checked volume and tonnage.
- Merge and register. Scans from multiple sensors are composited and aligned into one coordinate system, so a large yard or building is covered from several angles.
- Filter. Noise, stray returns and equipment such as loaders or conveyors are removed so only the material surface remains.
- Reconstruct the surface. Surface reconstruction (including methods such as Poisson surface reconstruction) turns the points into a continuous mesh of the pile.
- Compute volume. The volume between the pile surface and the base surface is calculated for each defined pile or bin.
- Convert to tonnage. A bulk density set for each material converts cubic yards or cubic feet into tons.
- Quality assurance. Hyperion shows where data was missing and interpolated, and flags or discards results of questionable accuracy.
Interactive 3D
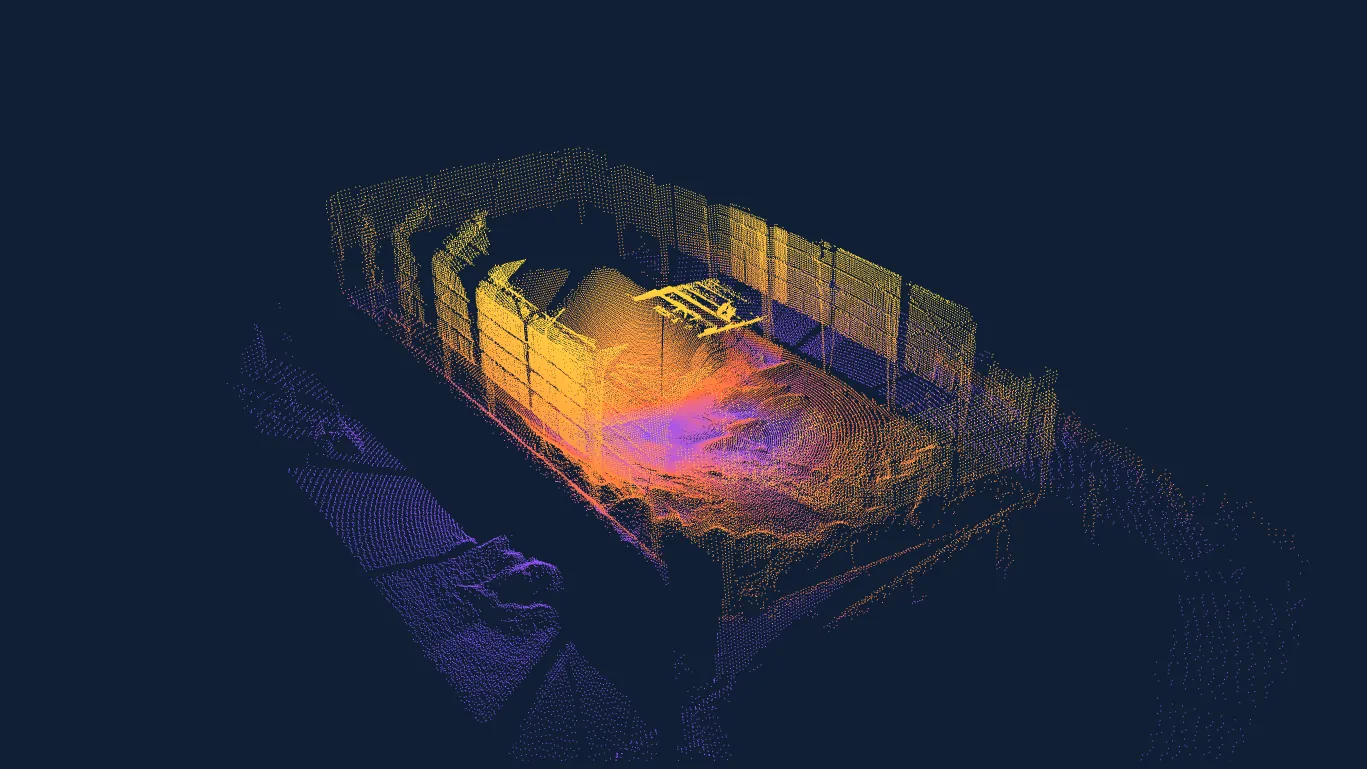
Explore a raw EOS2 point cloud
This is the starting point of every Hyperion measurement: unprocessed LiDAR data from a single EOS2 scan, rendered in your browser and colored by height.
Loading 3D model… (2.1 MB)
Comparison
LiDAR vs. drone stockpile surveys and other methods
Every inventory method trades off cost, effort and how often you get a number. Here is how the common approaches compare.
| Factor | Manual (walking wheel, visual estimate) | Truck tickets / book inventory | Drone photogrammetry or drone LiDAR | Fixed LiDAR (EOS2 + Hyperion) |
|---|---|---|---|---|
| Frequency | Occasional, often month-end | Continuous on paper, but never physically checked | Periodic flights, typically monthly or quarterly | Scheduled (daily or hourly) or on demand |
| Labor | Staff time on every measurement | Data entry and reconciliation | A pilot or survey contractor for each flight, plus processing | No field labor after installation |
| Safety exposure | People walk or climb on and around piles | None directly | Pilot on site near operating equipment | No one on the pile |
| Lighting and weather | Needs daylight and safe conditions | Not applicable | Needs suitable flight weather; photogrammetry needs good light; hard to fly inside buildings | Active laser works in any lighting, indoors and outdoors |
| Turnaround time | Hours to days, results vary by person | Immediate, but errors accumulate unseen | Often days, depending on processing | Minutes from scan to quality-checked volume |
| Automation | None | Automated bookkeeping, not measurement | Partial; each flight is planned and flown | Fully automated capture, processing and API export |
Drone surveys and fixed LiDAR are complementary. Hyperion accepts point clouds from processed drone flights and third-party scanners in common geospatial formats, so a site can use drone data for large open areas and EOS2 sensors for high-frequency monitoring of critical piles and enclosed storage. Truck tickets remain useful for transactions, but they carry their own scale and moisture errors, which is why a physical measurement is needed to reconcile them.
Accuracy
Accuracy and quality assurance
LiDAR is precise, but a volume is only as good as the data behind it. These are the factors that matter, and how Hyperion handles them.
Line of sight and occlusion
A laser can only measure what it can see. Walls, equipment and the far side of a tall pile create shadows. Mounting more than one sensor fills those gaps.
Material visibility
How well a surface reflects the laser affects range. Each EOS2 reaches 100 to 200 ft in every direction (200 to 400 ft across) depending on the material, and merging scanners extends system range without limit.
Sensor placement
Height and angle determine coverage. Overhead positions on trusses or poles look down on the pile and reduce hidden areas.
Density assumptions
Tonnage depends on the bulk density used for each material. Lab-verified densities keep the volume-to-ton conversion honest.
Flagged gaps
Hyperion shows where data was missing and interpolated, and flags or discards periods of questionable accuracy instead of hiding them.
Survey-grade results
At a Newberry, Florida cement plant, Hyperion came within 0.55% of a certified third-party terrestrial survey, with scan and processing in under 20 minutes and no downtime.
Read the details in our stockpile monitoring case studies, including control tests at an Ocala, Florida ready-mix plant where Hyperion agreed with truck tickets within 4 to 6%.
Installations
Where fixed LiDAR monitoring works
The EOS2 is IP54 rated, mounts on a standard 3/4" NPT pipe fitting and runs on low-power 12 VDC, so it fits most bulk storage layouts.
Indoor domes and sheds
Sensors mount on overhead trusses to look down on coal, limestone, fertilizer, grain or feed stored under cover, where drones struggle and daylight is limited.
Outdoor yards
Pole-mounted sensors cover open stockpiles of aggregate, sand and fuel. Low power draw makes solar installations practical where running cable is costly.
Bins and bunkers
Divided bins at ready-mix and aggregate plants are measured individually, so every material gets its own volume and tonnage.
See industry examples for cement plants, ready-mix concrete and coal and fuel storage.
Technology note
Emissions monitoring: a different sensor, the same data discipline
Altamus also builds software for air emissions compliance. STACguard is a web-based data acquisition system (DAS) that connects to the analyzers in a continuous emissions monitoring system (CEMS). It collects the readings, calculates averages and produces the reports environmental teams need, with the same focus on reliable, traceable data that drives Hyperion. Terms such as CEMS, DAHS and RATA are explained in our LiDAR and emissions monitoring glossary.
LiDAR stockpile measurement FAQ
Common questions about how LiDAR monitoring works.
A LiDAR sensor measures the distance to tens of thousands of points around the pile using the time of flight of laser pulses. Those points form a 3D point cloud. Software such as Hyperion reconstructs the pile surface from the point cloud, calculates the volume between that surface and the base, and applies a bulk density to report tonnage.
Accuracy depends on coverage, sensor placement and the density values used. At a Newberry, Florida cement plant, Hyperion measured an indoor coal stockpile within 0.55% of a certified third-party terrestrial survey. Hyperion also flags missing or interpolated data so you know how reliable each result is.
They serve different needs. Drone surveys are well suited to periodic measurement of large open sites. Fixed LiDAR measures on a schedule or on demand with no pilot and no one on site, works in any lighting and works inside buildings. Hyperion accepts both, so many sites combine them.
Yes. The EOS2 is an active sensor that supplies its own eye-safe Class 1 laser light, so it measures the same way in darkness, inside domes and sheds, or outdoors in daylight.
A full 360° × 180° EOS2 scan at 1° angular resolution takes about 3 minutes. Hyperion then processes and quality-checks the data within minutes. At the Newberry cement plant, scanning and processing together took under 20 minutes.
Each EOS2 covers 100 to 200 ft in every direction (200 to 400 ft across) depending on the material, and Hyperion merges data from any number of sensors. The right number depends on pile size, layout and obstructions. Contact us for a site review and recommended layout.
Contact
Ask about LiDAR monitoring for your site
Tell us about your materials, storage layout and how you measure inventory today, and we will recommend a sensor layout.
- +1 352-283-8003
- info@altamusinc.com
- 4936 SW 91st Ter M102
Gainesville, FL 32608