By Kyle Ulmer · · 8 min read
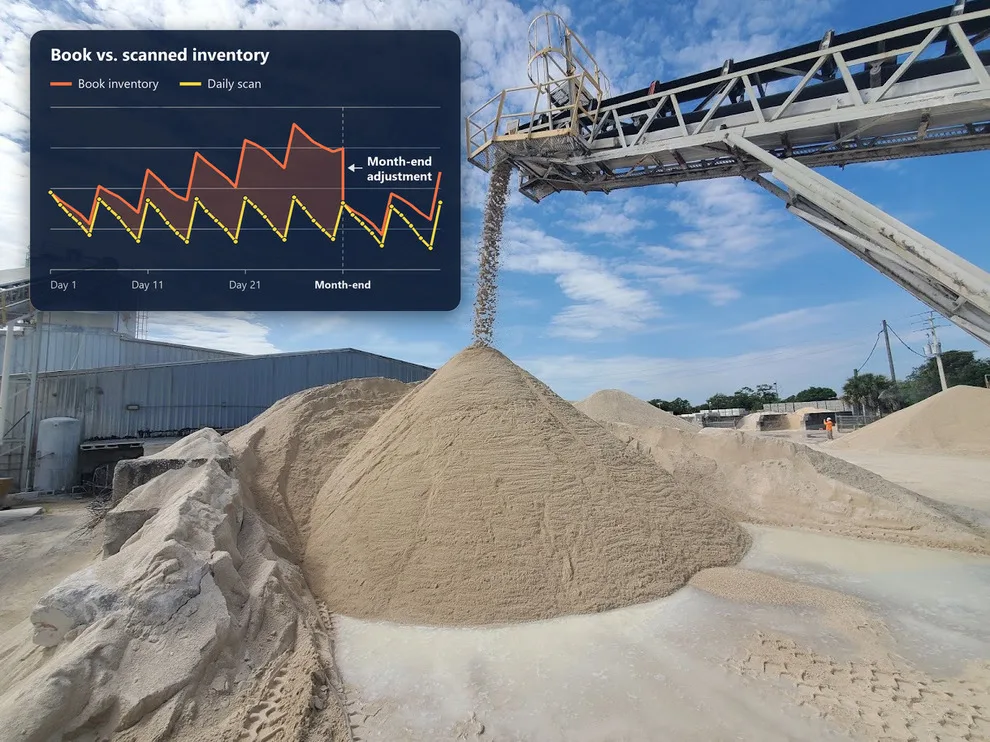
The short version: A month-end surprise is what happens when the books and the pile only meet once a month. The write-down is the part everyone sees. The bigger cost is everything that got decided on the wrong number in the weeks before it. Measure the piles more often and the surprise shrinks into a small correction you can actually explain.
In this article
What a month-end surprise looks like
If you run a plant that stores bulk material, you probably know the routine. All month, inventory lives in a spreadsheet or an ERP. Opening balance, plus what the tickets say came in, minus what production says went out. The number looks fine. It always looks fine, because nothing is checking it.
Then the last day of the month shows up. Somebody walks the yard, or a surveyor comes out, or a drone goes up. The physical number comes back, and it doesn't match the books. Sometimes it's close. Sometimes it's a few hundred tons off and nobody can say why.
So an adjusting entry gets made, there's an uncomfortable meeting, and everyone goes back to work. Next month the same thing happens again.
That adjustment is the surprise. Most plants treat it as an accounting annoyance. It's really a symptom, and the adjustment itself is the cheapest part of it.
Where the gap comes from
Book inventory is a running total of other people's numbers. Every one of those numbers is an estimate with its own error, and the errors pile up quietly in the same ledger.
- Receipts by ticket. Truck and rail tickets depend on scale calibration, and they weigh whatever is in the load, including water. A wet load of sand is a heavier ticket for the same amount of sand.
- Usage by production records. Batch records, belt scales and loader bucket counts all drift. A belt scale that reads a little low makes the books think there's more left than there is.
- Density. Any time a volume gets turned into tons, somebody picked a density. Moisture and compaction move it around, and the figure in the spreadsheet may not have been checked in years.
- Movements nobody wrote down. Material shifted between piles, used for site work, pushed into the pad, contaminated and scrapped, or just spilled along the way.
- The count itself. An eyeballed pile or a quick tape measurement isn't ground truth either. If the month-end count is rough, part of the "gap" is just the count being wrong.
None of these is dramatic on its own. The trouble is that they all land in one number, and that number goes 30 days without being checked against anything real.
We saw this play out at the Quikrete Ocala ready-mix plant, which tracked aggregate purely by truck tickets. Over three months, theoretical inventory, physical inventory and Hyperion scan data were compared side by side, and ticket-based gaps of more than $160k turned up. In two control tests on single deliveries, the tickets and the scan differed by 4% and 6%. That's not much on one load. It's a different story when it applies to every load for a quarter.
What it really costs
The write-down is the visible cost. Here's the rest of the bill.
You bought the wrong amount
Purchasing runs on the book number. If the books say you have more than you do, you find out when a pile runs short, and then it's rush orders, premium freight or a production stop. If the books say you have less than you do, you order early and tie up cash in material that sits there. Either way the money was spent weeks before month-end told you the number was off.
Your costs were wrong all month
If inventory is off, so is usage, and so is cost of goods. Every margin report, job cost and yield figure built during the month carried the same error. The adjusting entry fixes the balance sheet. It doesn't go back and fix the decisions that were made from those reports.
Somebody has to go looking
A big variance means an investigation. The plant manager, the controller and a couple of operators spend hours digging through a month of tickets and batch records, trying to remember what happened on the 9th. Most of the time the answer is "unexplained variance," because there's nothing to compare the paperwork against.
The real problem stays hidden
This is the expensive one. A scale that's out of calibration, a supplier that runs consistently short or a mix that uses more material than the design says will all show up as the same thing: one lump adjustment at month-end. You can see that you lost material. You can't see when or where, so you can't fix it, and it comes back next month.
People stop trusting the number
After a few bad months, finance stops believing operations, and operations starts padding. Auditors and lenders ask more questions. A balance sheet with a stockpile on it is only as good as the last time someone measured that stockpile.
Quick example
These are made-up round numbers, just to show the shape of it. Say a plant carries $1,000,000 of material and the books drift 3% over a month. That's a $30,000 adjustment.
Found on day 30, that $30,000 is spread across a month of deliveries and production, and there's no way to tell which ones. Found on day 2, it's about $2,000, and there are only a handful of tickets it could have come from.
Same error rate. The only thing that changed is how long it was allowed to run.
Why a better month-end count doesn't fix it
The natural reaction is to tighten up the count. Hire a surveyor. Fly a drone. Get a really good number on the last day of the month.
That helps, but less than you'd think. A perfect count once a month tells you exactly how big the gap is. It still doesn't tell you when it opened up or why. You've got one data point and 30 days of transactions between it and the last one.
And there's a reason nobody counts more often. Manual surveys take people off other work and put them on or around the piles. Drone flights need a pilot, decent weather and processing time. So the count happens when it has to, which is month-end, which is exactly when it's too late to do anything about what it finds.
The fix isn't a more accurate month-end. It's a shorter gap between checks.
What frequent measurement changes
This is the problem Hyperion was built for. Fixed EOS2 LiDAR sensors are mounted over the piles and scan on a schedule, daily or hourly depending on the plan, or whenever you ask. Nobody has to go out on the pile. Hyperion merges the scans, filters out loaders and other equipment, rebuilds the pile surface and works out the volume in minutes. Apply your material density and you have tons.
Once that's running, month-end looks different.
- You reconcile daily, not monthly. Compare what the scan says changed with what the tickets and production records say changed. A gap shows up the next morning, while people still remember what happened.
- You can check a single delivery. Scan before, scan after, compare to the ticket. That's how the control tests at Ocala were done.
- Problems have a date on them. A scale that starts drifting or a supplier that starts running short shows up as a trend that begins on a particular day, not as a mystery at the end of the month.
- The number comes with evidence. Every scan is kept. For any date, you can pull up the 3D model and height map of the pile as it stood, which is a much better answer for an auditor than "that's what the spreadsheet said."
- You know how much to trust it. Hyperion's quality checks show which parts of the surface were actually measured and which were filled in, and flag scans that shouldn't be relied on.
- Finance and operations see the same thing. Results go to the dashboard and out through the API to your ERP or reporting tools.
On accuracy: at a cement plant in Newberry, Florida, Hyperion's estimate for an indoor coal pile came within 0.55% of a certified third-party terrestrial survey. The scan and processing took under 20 minutes with the plant running.
Two honest caveats. First, a scan measures volume. Tons still depend on density, so it's worth getting that figure right for each material. Second, this doesn't replace tickets. Tickets record transactions. Scans check them. You want both.
By the time month-end arrives, the books have already been corrected a couple dozen times in small steps. The adjusting entry is still there. It's just boring.
A month-end checklist
You can start on most of this before installing anything.
- Look at the last 12 adjustments. How big were they, and which direction? If they always go the same way, there's a systematic cause, not bad luck.
- List every number that feeds the books. Truck scales, belt scales, batch weights, densities. Write down when each one was last verified.
- Run a control test. Isolate one pile, measure it, take a few deliveries, measure it again and compare with the tickets.
- Shorten the interval where it matters most. Start with your most valuable or fastest-moving material. Weekly beats monthly. Daily beats weekly.
- Set a threshold. Decide how big a gap between book and measured inventory triggers a look, so small problems get caught while they're still small.
- Keep the evidence. Tie every reported number to a dated measurement someone can go back and look at.
Want to know how big your gap really is?
Our 90-day Hyperion pilot runs on your own piles and includes a side-by-side comparison with the way you count inventory today. Tell us what you store and how you track it, and we'll show you what the scans would catch. Talk to an engineer.
Related reading
- Quikrete Ocala ready-mix case study: Hyperion scans against truck tickets, month by month.
- Newberry cement plant case study: a coal pile measured to within 0.55% of a certified survey.
- How LiDAR stockpile measurement works: from laser pulse to point cloud to quality-checked tonnage.
- LiDAR line-of-sight limits: where blind spots come from and how sensor placement gets rid of them.
Comments
No comments yet. Questions and field experience are welcome.
Leave a comment