Hyperion for Salt Storage
Road salt inventory that is ready before the storm is
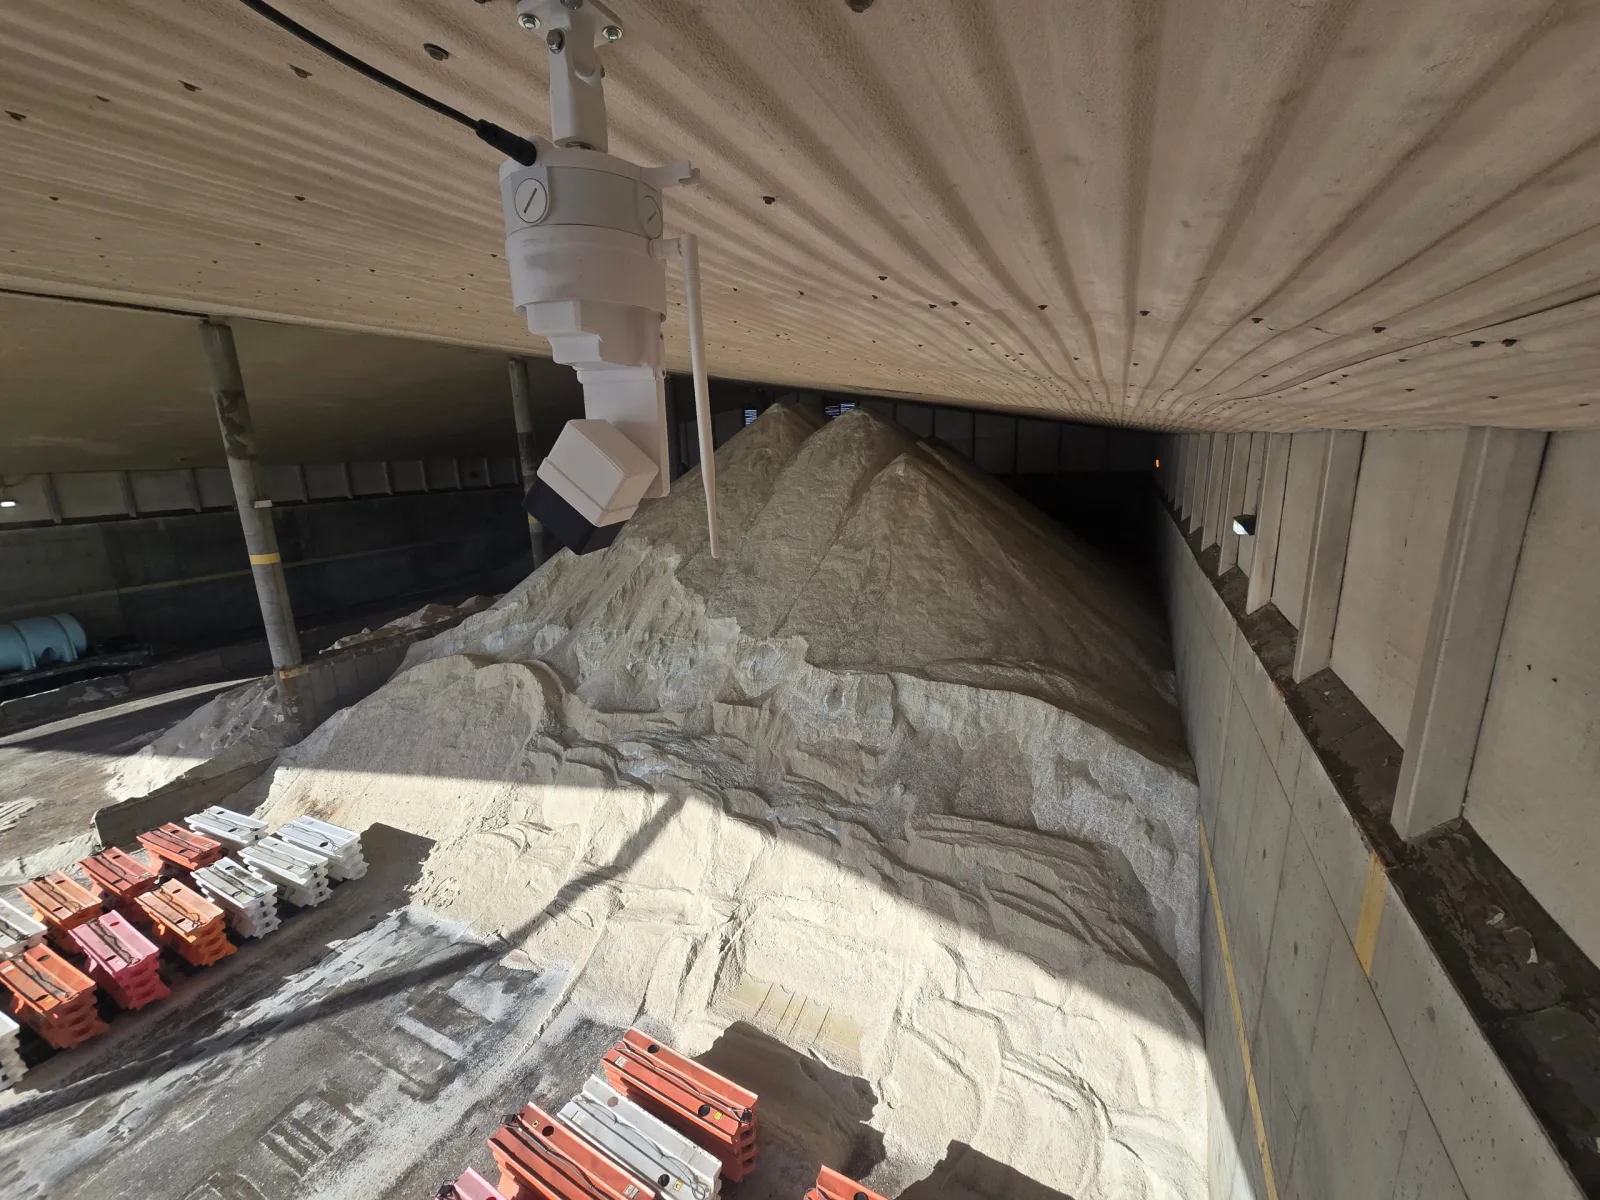
Hyperion measures every salt shed with one or two roof-mounted LiDAR sensors, so DOT districts, counties and public works crews know their tonnage to the day instead of to the season, without anyone driving out to pace a pile.
The challenge
Why salt inventory is so hard to keep right
Salt is bought by the ton, spread by the truckload and counted by eye. Between the delivery ticket and the spreader, a lot of it goes unaccounted for.
Usage spikes with the weather
One storm can empty a shed. A count taken last month says nothing about what is left tonight, and ordering on the memory of last season is a gamble.
Estimates from the loader seat
Most salt sheds are counted by eye or by bucket loads, a few times a year. Ridges from loading, salt pushed up the walls and caked edges all fool the estimate.
Dozens of sites, one small crew
A district keeps salt at many truck stations across hundreds of lane-miles. Driving out to measure each one costs a day and pulls operators off the road when they are needed most.
Moisture, caking and shrinkage
Salt absorbs moisture, cakes and leaches brine. The density used to turn volume into tons drifts with it, and the season-end count turns into a write-off nobody can explain.
What Hyperion changes
Sensors at the ridge, a tonnage on the dashboard
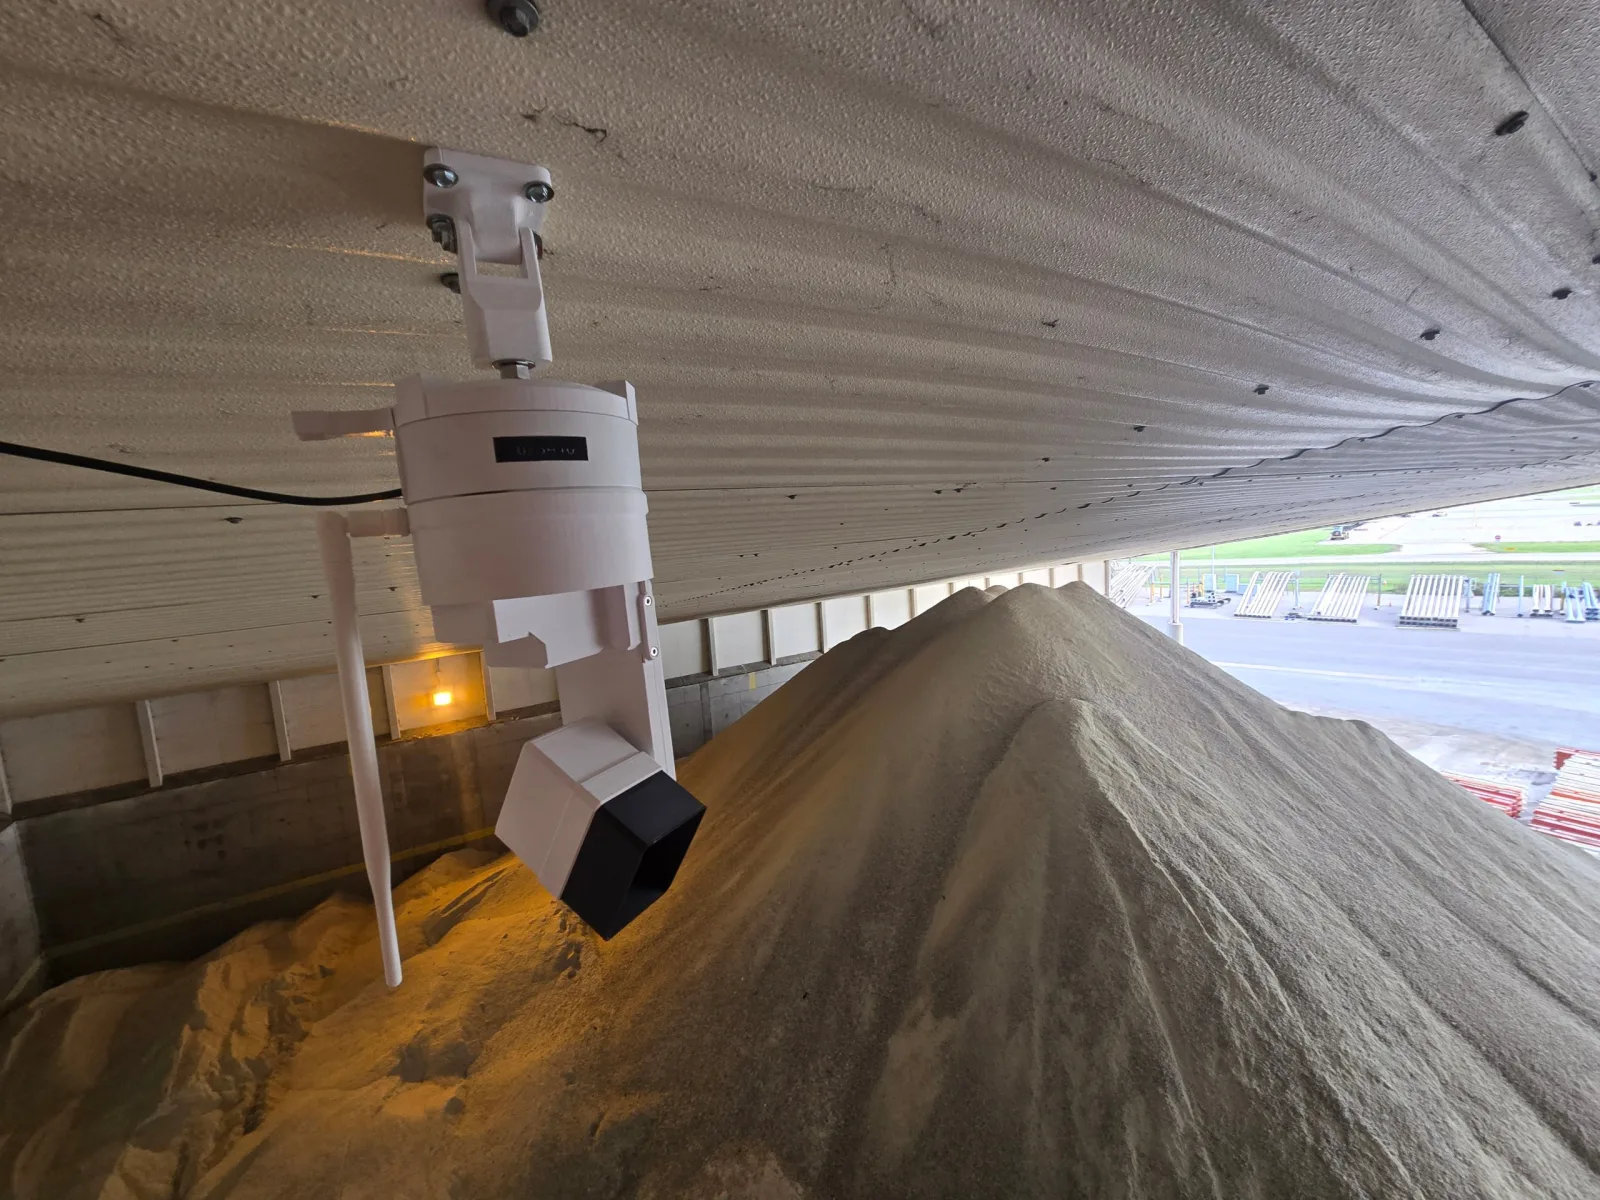
One or two EOS2 LiDAR sensors mounted to the ridge beam or roof truss see the whole floor of a salt shed: a compact building needs one, and a long or wide one gets a second so no corner is in shadow. They scan the pile on a schedule or on demand, in minutes, with no one entering the building and no interruption to loading.
Hyperion turns each scan into a 3D surface, subtracts the floor and walls, applies the bulk density you set for the material and reports the volume and tonnage. Every scan is kept, so you can see how fast a shed drains during a storm and how much a delivery really added.
- Eye-safe Class 1 laser that runs while loaders work underneath it.
- Scans through dust and in the dark, in fabric barns, domes and open-front sheds.
- Low-voltage power and Wi-Fi: no conduit across the floor, no cabling in the salt.
Live examples
Three salt sheds, scanned from the roof
Interactive scans from a recent installation for a state department of transportation. Each building is covered by one or two EOS2 sensors mounted at the ridge, and Hyperion merges their scans into the single model you see below.
A compact shed holding treated salt, with a spreader truck parked inside. One sensor at the ridge sees the whole floor.
Loading 3D model… (3.4 MB)
A wide shed with several conical piles dumped along the back wall and equipment stored at the front. Two sensors cover it so neither side is in shadow.
Loading 3D model… (7.2 MB)
A long barn with the salt pushed high against both side walls and a loader lane down the middle. Two sensors along the ridge reach both ends.
Loading 3D model… (7.2 MB)
Volume to tons
Get the density right and the tonnage follows
LiDAR measures volume. Tons come from the bulk density you apply to it, and salt is less predictable than most materials. Dry rock salt is usually quoted around 70 to 80 lb per cubic foot, close to one ton per cubic yard, but moisture, gradation and compaction under the loader move that number, and treated salt and sand-salt mixes have densities of their own.
Hyperion keeps a density per material and per site, so each shed converts with the figure that fits it. The simplest way to check it is a delivery: compare the ticketed tons against the measured change in the pile, and adjust the density until the two agree. After that, every scan reports in the same tons your orders and budgets use.
How it works
How it works for a DOT or public works department
Three steps, repeated for every shed in the district, with nobody leaving the office.
Scan
The EOS2 sensor scans each shed on a schedule, for example every night during the season, and on demand from the dashboard after a storm or a delivery. A scan takes a few minutes and does not disturb loading.
Process
Hyperion filters out loaders, trucks and stored equipment, reconstructs the pile surface, computes the volume and applies the material density. Quality checks flag any area the sensor could not see.
Act
Tonnage for every shed appears on one dashboard with history and trends. Set a reorder point per site and get an alert when it is crossed, verify deliveries against the measured change, and send the numbers to your materials management system through the API.
Who it is for
Where it fits
Anyone who stores salt by the thousand tons and answers for it at the end of the season.
State DOT truck stations
Statewide visibility of salt at every station, so districts can balance stock between sites, time reorders and reconcile the season without a measuring campaign.
County and municipal public works
A dependable count for a handful of sheds, on a budget. Know what is on hand before a storm and justify next year's order with measured usage.
Salt suppliers and terminals
Track stock in storage domes and at vendor-managed sites, confirm what was shipped against what left the pile and settle disputes with a dated 3D record.
Airports, turnpikes and contractors
Private snow and ice operations that store salt for a client or a contract get the same measured inventory to bill and report against.
Real buildings, real clutter
Treated salt, sand and the truck parked next to it
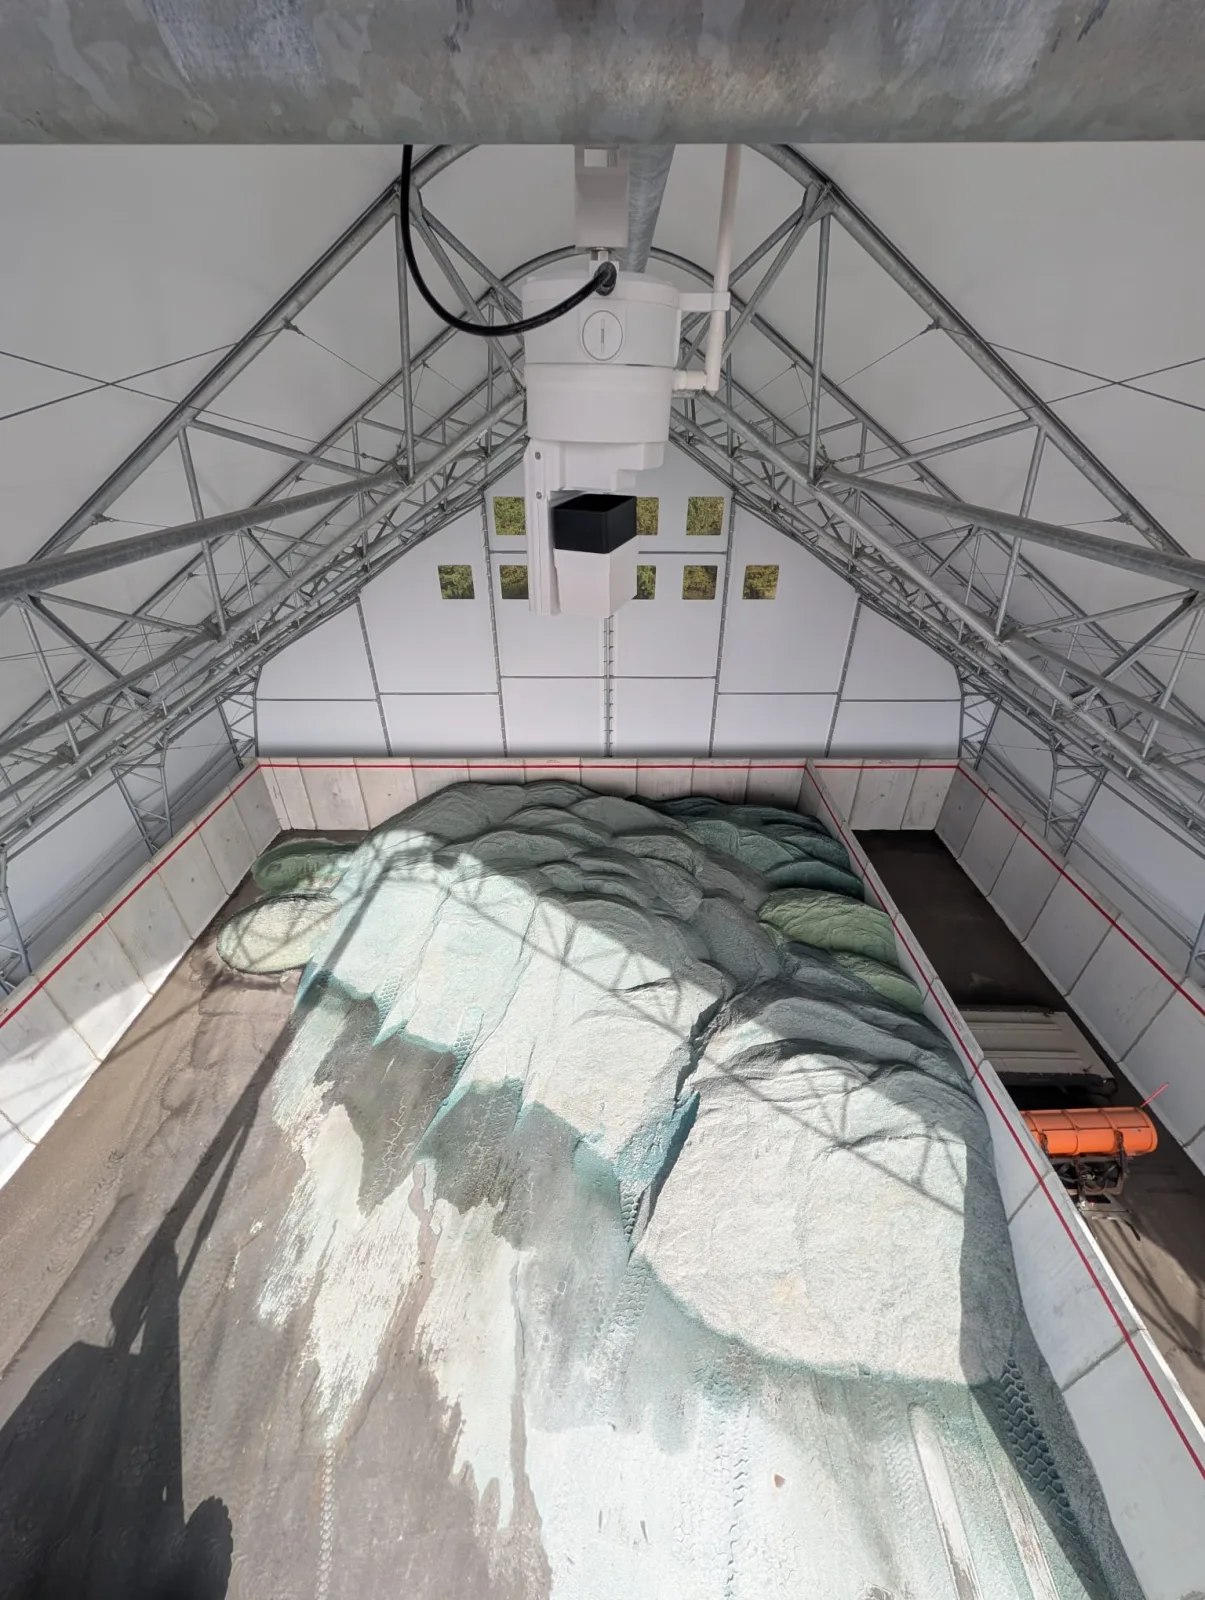
Salt sheds are working buildings. Treated salt sits beside plain salt, a sand-salt mix fills one corner, a spreader is parked inside overnight and loaders push the pile up the walls during a storm. Hyperion handles that: each material gets its own boundary and density, and equipment is recognized and removed from the surface before the volume is computed.
Because the sensor is fixed, every scan is taken from the same spot. That makes the history trustworthy: the difference between two scans is salt that was spread or delivered, not a difference in how someone paced the pile.
Before the next season
Stop counting salt by the bucket
A sensor or two per shed and one dashboard for the district replaces the annual measuring campaign, the storm-week guesswork and the year-end write-off with numbers you can act on the same day.
Plan a salt storage pilotSalt storage monitoring FAQ
Yes. The EOS2 sensor measures the pile surface with its own laser, so the lighting and roof material do not matter. It mounts to a ridge beam, roof truss, purlin or the dome structure with a standard pipe fitting, and one sensor covers a compact shed. Long or wide buildings get a second sensor, as two of the three sheds in the scans above did, and Hyperion merges the scans into one model.
Yes. Scans run during normal operations. Hyperion recognizes vehicles and equipment and removes them from the surface before computing the volume, and the quality check shows any part of the pile that was hidden at the time of the scan.
The EOS2 runs on 12 V DC with a very low idle draw and communicates over Wi-Fi, so it needs only low-voltage power at the roof and a connection to the site network or a cellular gateway. Nothing is installed on the floor or in the pile.
It applies the bulk density you set for each material and site. Dry rock salt is typically around 70 to 80 lb per cubic foot, roughly one ton per cubic yard, and treated salt and sand-salt mixes have their own figures. Checking the measured change against a ticketed delivery is the easiest way to confirm the density for a shed.
Yes. Volumes, tonnages and scan history are available through the Hyperion API and as exports, so a statewide inventory system, an ERP or a BI dashboard can read the current stock for every site and trigger reorders at the threshold you set.
A sensor on a pole can scan tarped or uncovered piles outdoors. On a tarped pile it measures the tarp surface, which follows the pile closely; on an uncovered pile it measures the salt directly. Talk to us about the layout and we will recommend a sensor position.
Related Solutions
Contact
Talk to us about your salt storage
Tell us how many sheds you have, what they are built from and what you store in them, and we will recommend a sensor layout and a Hyperion plan.
- +1 352-283-8003
- info@altamusinc.com
- 4936 SW 91st Ter M102
Gainesville, FL 32608