By Kyle Ulmer · · 5 min read
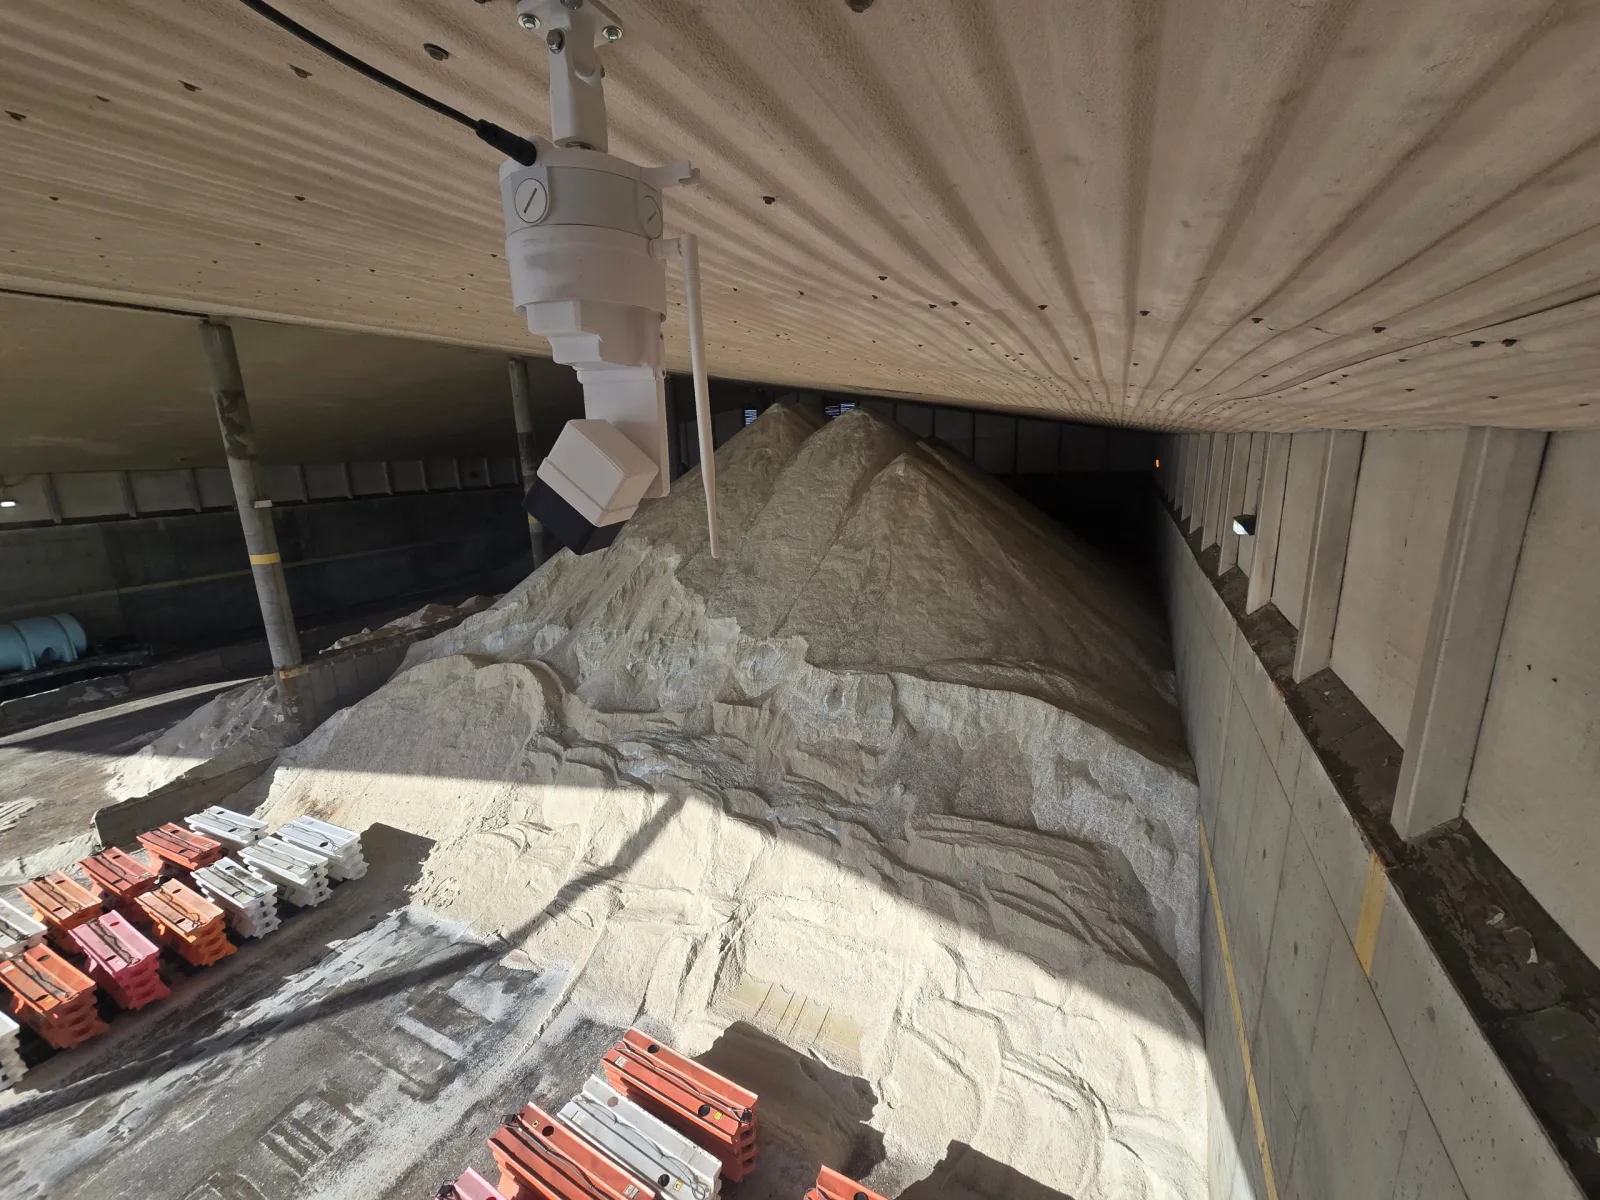
We recently finished an installation for a state department of transportation: three road salt storage buildings at three truck stations, each now measured from the roof by EOS2 LiDAR sensors and reported in Hyperion. One building needed a single sensor. The other two needed a pair. Here is what the three buildings looked like, why the sensor count differed, and what the district gets from each scan. Each building's scan is below, so you can rotate the real point cloud yourself.
Why salt is worth measuring
Road salt is bought by the ton, spread by the truckload and, in most sheds, counted by eye. A count taken in November says little about what is left after a two-day storm in January, and the person who knows the shed best is usually in a plow at the time. Between deliveries, loader estimates and brine leaching out of the pile, the number in the books and the pile on the floor drift apart, and the gap shows up as a year-end write-off that nobody can explain. We wrote about that pattern in the hidden cost of month-end inventory surprises, and salt is one of the clearest cases of it.
A sensor at the ridge changes the routine. Every scan becomes a volume, every volume becomes a tonnage, and the district can see how fast each shed drains during a storm and how much a delivery really added, without anyone driving out to pace a pile.
The three buildings
A compact shed: one sensor
The smallest of the three holds treated salt, with a spreader truck often parked inside next to the pile. One EOS2 at the ridge sees the whole floor, including the truck, which Hyperion filters out of the pile surface before it computes the volume.
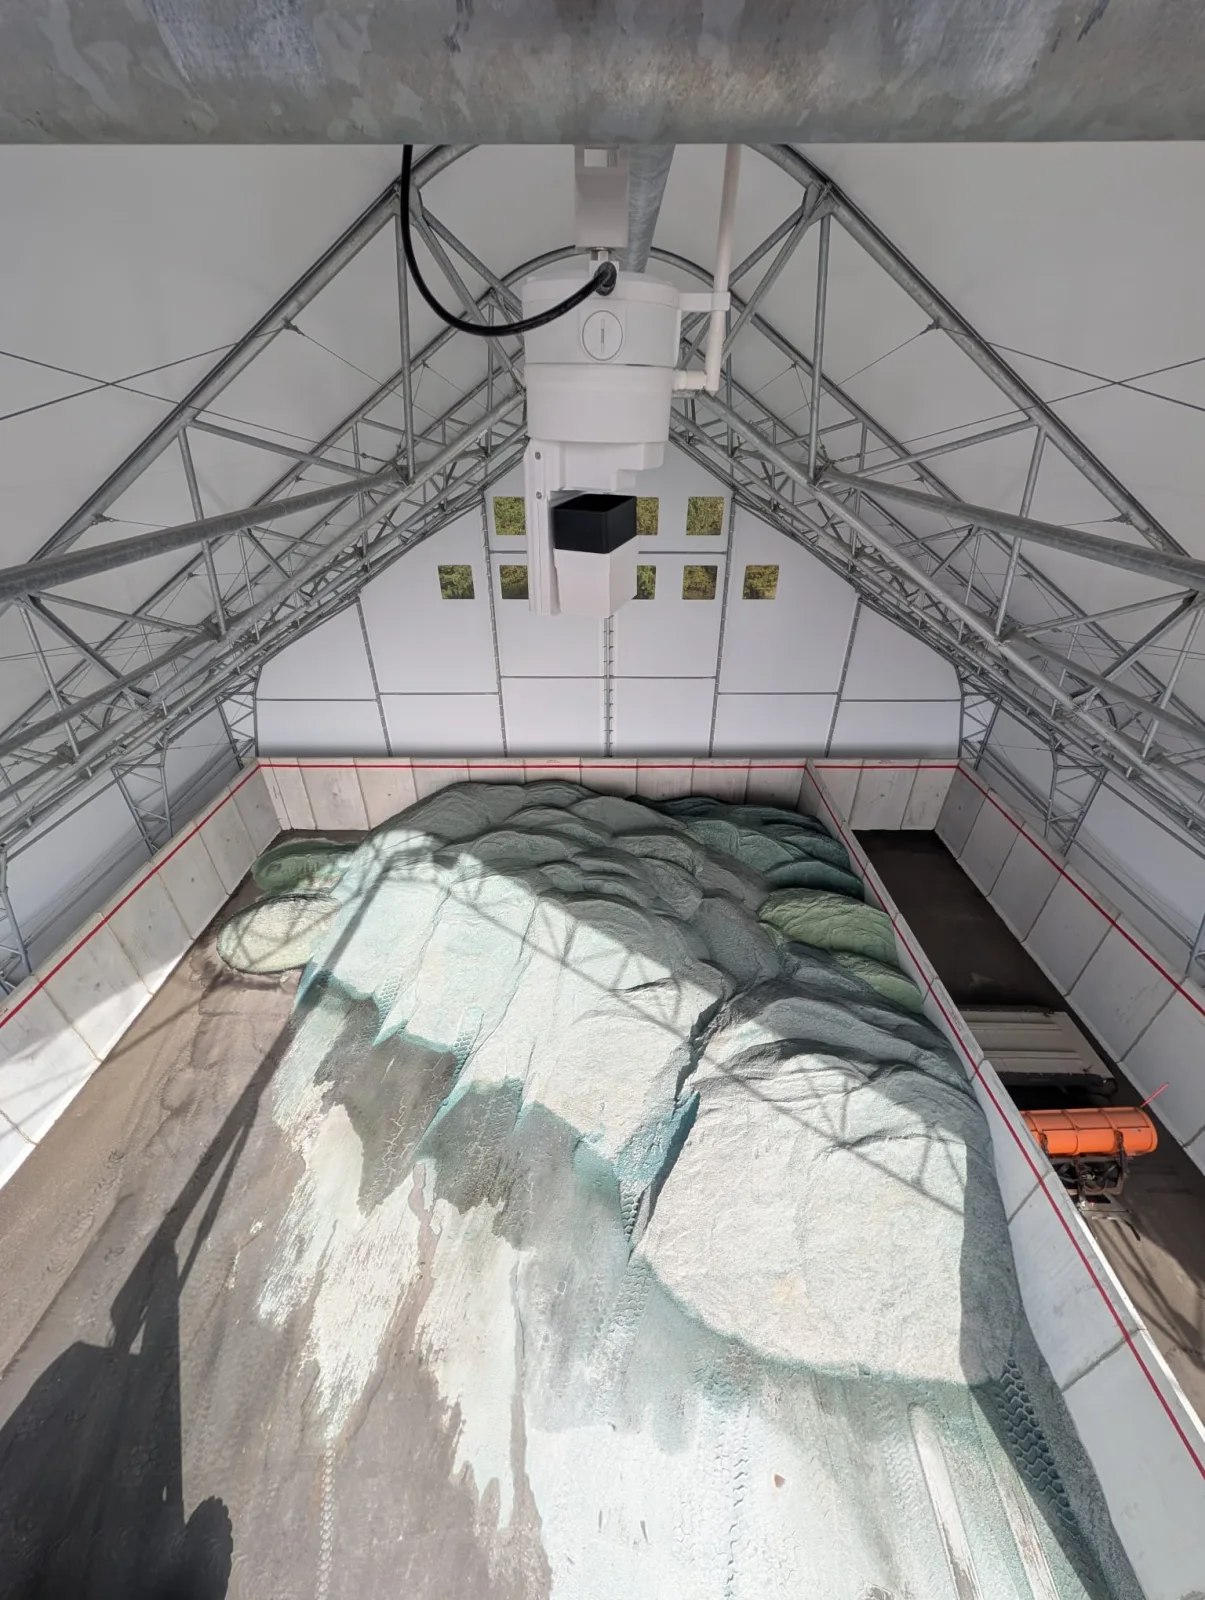
This is the scan from that one sensor. The pile is the mound in the middle, the truck is the block beside it, and the walls and roof framing are the thinner points around them.
Loading 3D model…
A wide shed: two sensors
The second building is wide and open at the front, and the salt is dumped in several conical piles along the back wall, with equipment stored near the entrance. The peaks of the piles shadow the salt behind them from any single point on the ridge, so this shed got two sensors, one over each half, and Hyperion merges their scans into one model.
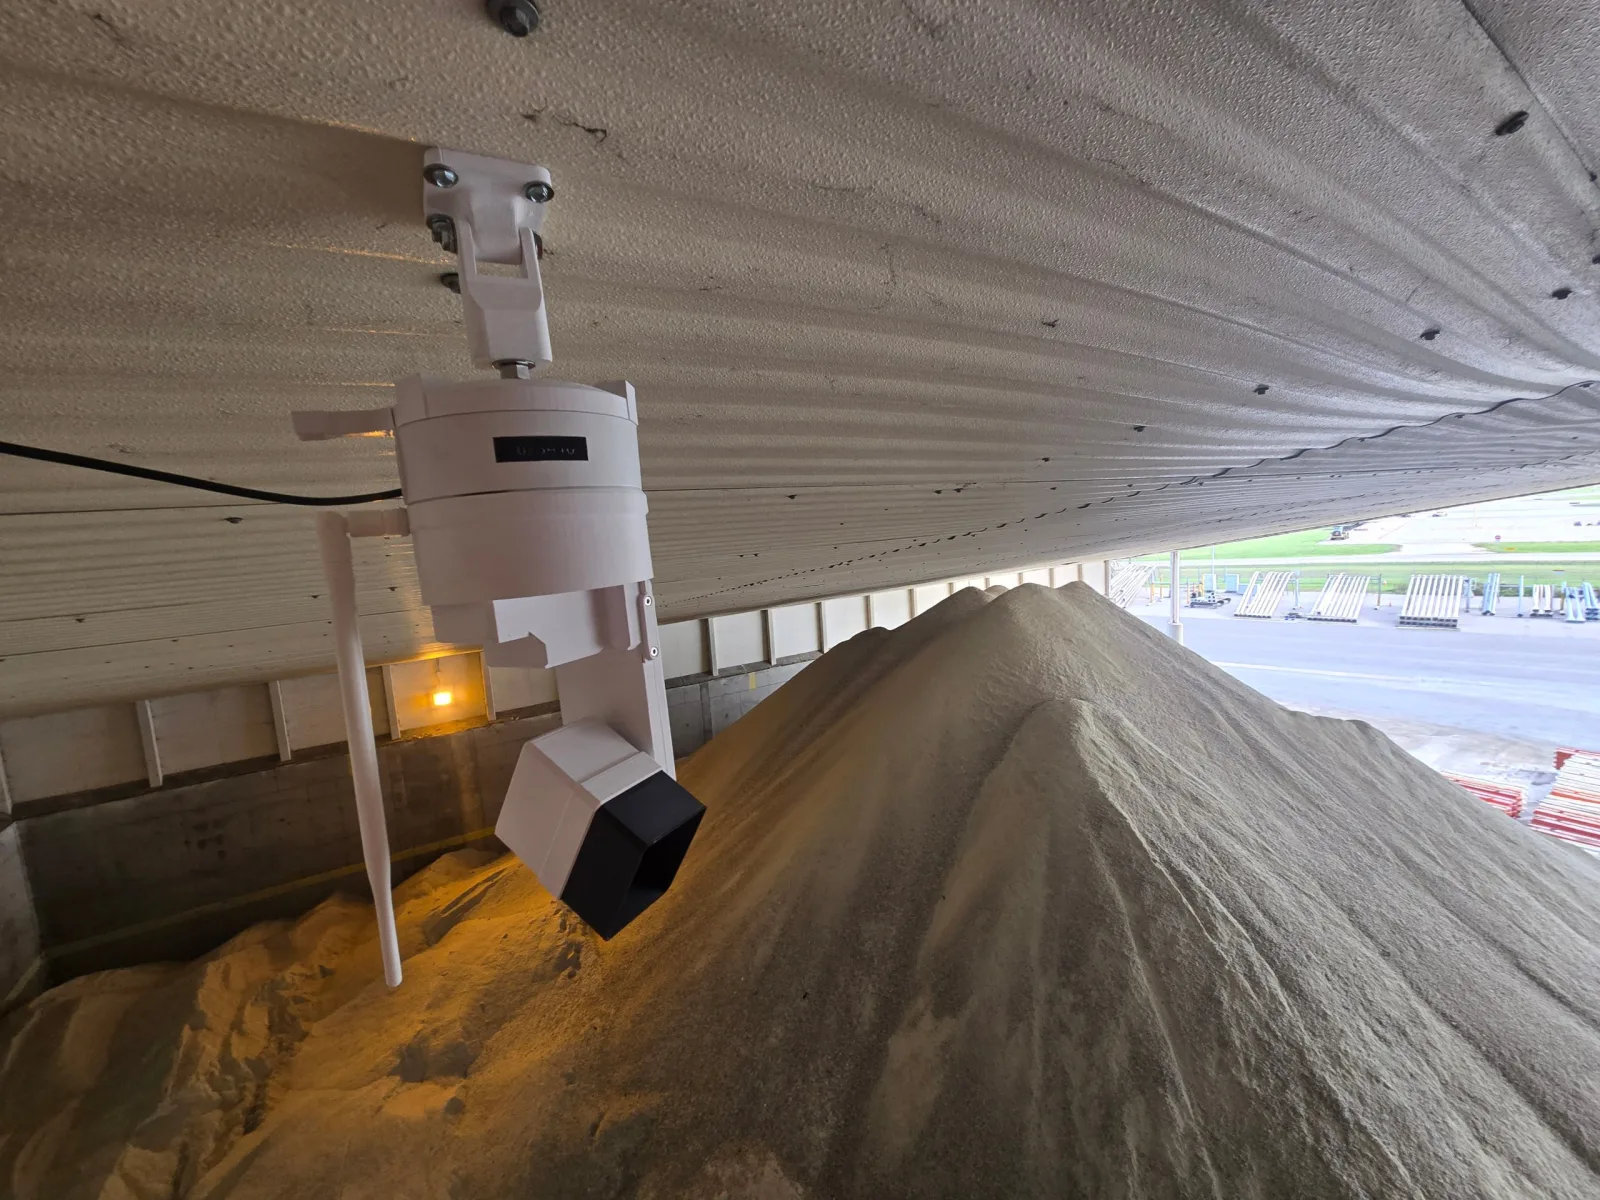
The merged scan from both sensors. Each conical pile along the back wall is complete, including the far side that one sensor alone could not see.
Loading 3D model…
A long barn: two sensors
The third building is a long barn with the salt pushed high against both side walls and a loader lane down the middle. A sensor's range is fine for the width of the building, but the far end of a long pile is viewed at a shallow angle from a single mounting point and the near slope hides the far slope. Two sensors spaced along the ridge see each end from above, and again Hyperion merges the pair into one model.
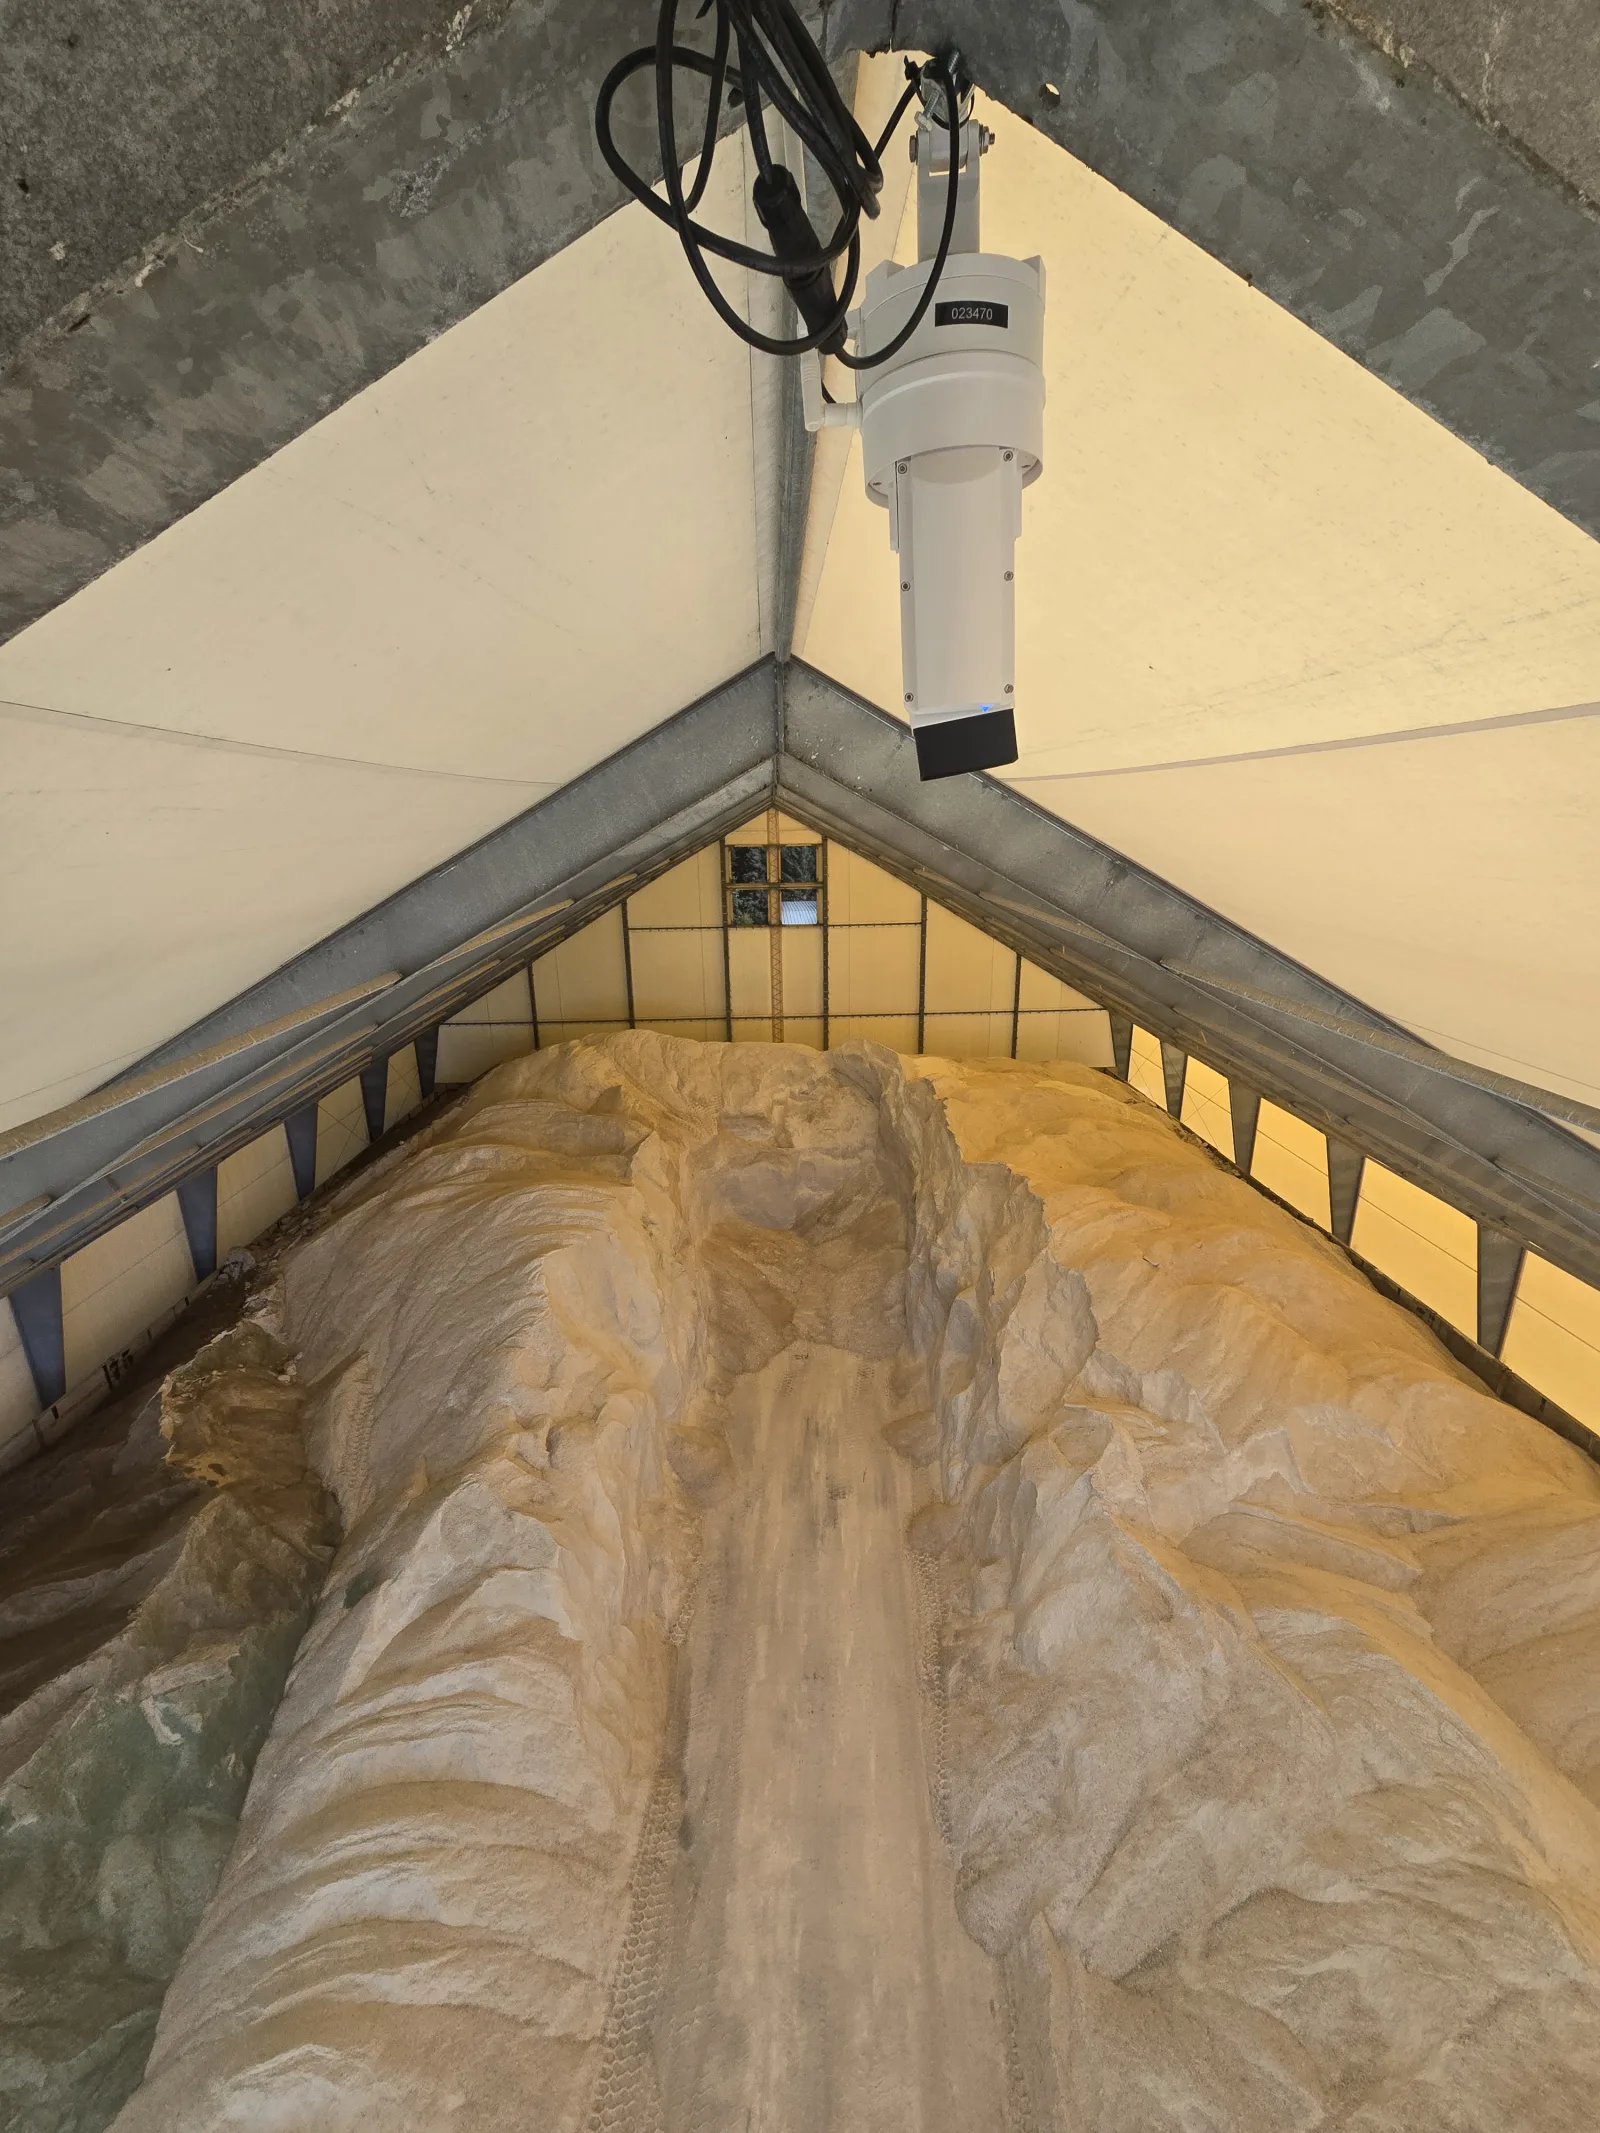
The merged scan of the barn, looking down its length. The salt runs the full length of both walls with the loader lane between.
Loading 3D model…
How we decide on one sensor or two
LiDAR measures only what it can see. In a salt shed the things that hide salt are the pile itself, the walls it is pushed against and whatever is parked inside. We have written about these blind spots in LiDAR line-of-sight limits, and about lining up the scans from a pair of sensors in point cloud registration. The short version for salt storage:
- A compact shed where the pile sits under the ridge is covered by one sensor.
- A wide shed with several piles, or salt against both long walls, gets a second sensor so neither side is in the shadow of the other.
- A long barn gets a second sensor along the ridge so both ends are seen from above rather than at a grazing angle.
Two of the three buildings on this project fell into the second and third cases. Five sensors cover three sheds.
Mounting at the ridge
Each EOS2 mounts to the ridge beam or a roof truss with a standard pipe fitting. It runs on low-voltage power and talks over Wi-Fi, so there is no conduit across the floor and no cabling in the salt. The laser is eye-safe Class 1, so scans run while loaders work underneath. Salt barns are hard on equipment, with brine in the air and dust whenever a loader moves, and the sensor was designed for exactly that kind of site.
What the district gets
Each scan reaches Hyperion within minutes. The software builds a 3D surface of the pile, subtracts the floor and walls, removes trucks and equipment, and applies the bulk density the district sets for the material in that shed, whether it is plain rock salt, treated salt or a salt and sand mix. The result is a volume and a tonnage for every scan, kept as a history:
- Tonnage to the day for every shed, from the office, before and after each storm.
- Delivery checks: the scan after a delivery minus the scan before it is the tonnage that actually landed on the floor.
- Drawdown during a storm, so reorders go out while there is still time for the truck to arrive.
- Low-stock alerts when a shed drops below the level the district chooses.
The same three scans are on our salt storage page, with the full rundown of what Hyperion does for salt sheds, from delivery checks to reorder alerts.
Keep salt at several truck stations? Tell us how your sheds are laid out and we will recommend a sensor layout and a Hyperion plan. Talk to us about your salt storage.
Comments
No comments yet. Questions and field experience are welcome.
Leave a comment